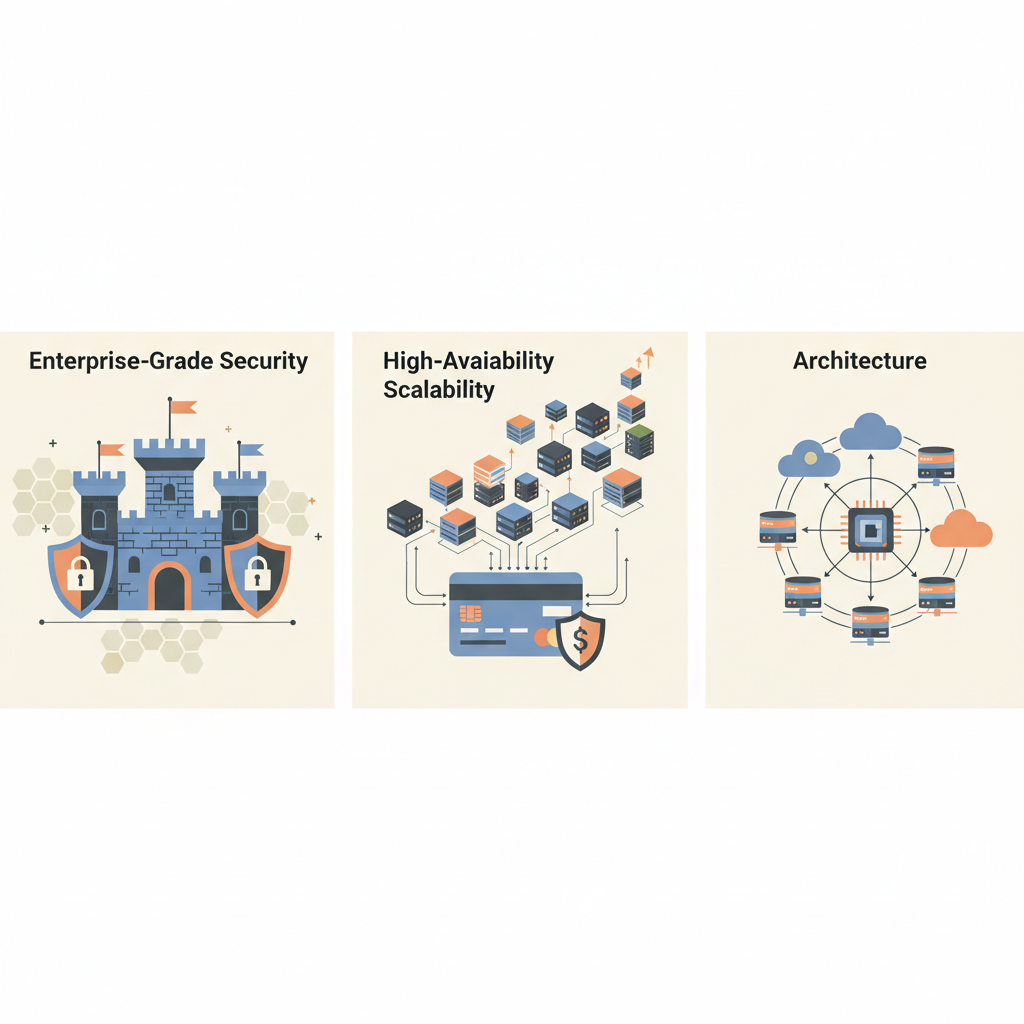
TL;DR — Building a payment platform that never sleeps requires active‑active replication, event‑driven pipelines, and a security‑first mindset. By combining proven HA patterns, sharding strategies, and PCI‑DSS aligned controls, engineers can deliver a system that scales with transaction volume while staying compliant.
Payment systems sit at the intersection of revenue, trust, and regulatory scrutiny. A single millisecond of latency can translate into lost conversions, while any data breach erodes brand equity overnight. In this post we unpack the architecture decisions, production patterns, and tooling choices that let large‑scale enterprises run payment services with five‑nines availability, elastic throughput, and enterprise‑grade security.
System Overview
A modern payment platform typically consists of three logical layers:
- Ingress Layer – APIs, SDKs, and webhooks that accept payment initiation requests from merchants, mobile apps, or partner services.
- Core Processing Layer – Orchestrates authorization, settlement, risk scoring, and ledger updates.
- Outbound Layer – Communicates with external acquirers, card networks, and fraud‑management services.
Below is a simplified diagram of the data flow (illustrative only; real deployments will have additional adapters and fallback paths).
client → Load Balancer → API Gateway → Auth Service → Risk Engine → Transaction Service → Settlement Service → Acquirer APIs
Each hop must be idempotent, observable, and recoverable. The design patterns we discuss later enforce those properties at scale.
Core Transaction Flow
- Request Validation – The API gateway validates JSON schema, authenticates the merchant via OAuth2, and rate‑limits the call.
- Authorization – A call to the issuing bank’s authorization endpoint is made; the response is persisted atomically.
- Risk Evaluation – A streaming risk engine consumes the transaction event, applies ML models, and may flag the transaction for manual review.
- Ledger Write – The transaction is written to an append‑only ledger (e.g., Apache Kafka + ksqlDB or a purpose‑built event store).
- Settlement – At batch intervals, settlement jobs reconcile successful authorizations with the acquirer and post‑settlement entries.
All steps are orchestrated by a state machine implemented in a workflow engine such as Temporal.io or Apache Airflow. The state machine guarantees exactly‑once processing even when individual services retry.
High Availability Patterns
Active‑Active Replication
Running two or more data centers (or cloud regions) in active‑active mode eliminates a single point of failure. The core ledger is replicated using a conflict‑free replicated data type (CRDT) or a dual‑write quorum strategy.
# Example Kubernetes StatefulSet for a replicated PostgreSQL cluster using Patroni
apiVersion: apps/v1
kind: StatefulSet
metadata:
  name: pg-primary
spec:
  serviceName: pg
  replicas: 3
  selector:
    matchLabels:
      app: pg
  template:
    metadata:
      labels:
        app: pg
    spec:
      containers:
      - name: postgres
        image: patroni/postgres:15
        env:
        - name: PATRONI_SCOPE
          value: payment-cluster
        - name: PATRONI_NAMESPACE
          value: /db/
        - name: PATRONI_RESTAPI_CONNECT_ADDRESS
          valueFrom:
            fieldRef:
              fieldPath: status.podIP
        ports:
        - containerPort: 5432
Patroni handles leader election via etcd, ensuring that a new primary is promoted within seconds of a failure. To keep latency low for global merchants, each region hosts a read‑only replica that serves queries for non‑critical data (e.g., transaction history).
Circuit Breaker & Bulkhead
External acquirer APIs can become flaky. A circuit breaker around each third‑party client prevents cascading failures, while a bulkhead isolates thread pools per partner.
# Python example using the pybreaker library
import pybreaker
import requests

breaker = pybreaker.CircuitBreaker(fail_max=5, reset_timeout=30)

@breaker
def authorize_with_acquirer(payload):
    response = requests.post("https://api.acquirer.com/auth", json=payload, timeout=2)
    response.raise_for_status()
    return response.json()
If the breaker trips, the system falls back to a queued retry stored in Kafka, guaranteeing eventual consistency without blocking the main request thread.
Geo‑Distributed DNS Failover
A global traffic manager (e.g., AWS Route 53 latency‑based routing) directs client traffic to the nearest healthy region. Health checks monitor the /healthz endpoint of the API gateway; if a region fails its checks, Route 53 automatically reroutes traffic within seconds.
Scalability Strategies
Sharding and Partitioning
Transaction volume can grow from thousands to millions per second during sales events. Horizontal sharding distributes load across independent database partitions.
- Key‑based sharding: Use a hash of the merchant ID to determine the shard. Guarantees that all of a merchant’s data lives in the same partition, simplifying per‑merchant reporting.
- Range‑based sharding: Partition by timestamp for time‑series workloads, enabling efficient archival and back‑fill.
In practice, a combination works best: primary sharding by merchant, secondary by time. Tools like Vitess or Citus (PostgreSQL extensions) provide transparent query routing across shards.
Event‑Driven Architecture with Kafka
Kafka excels at decoupling services and providing durable, replayable logs. The core processing pipeline can be modeled as a series of topics:
payment_requests– inbound API payloadsauth_responses– results from issuing banksrisk_events– enriched risk scoresledger_entries– final committed transactions
Consumers subscribe with consumer groups that match the number of processing instances, achieving linear scalability.
# Create topics with appropriate replication and partition counts
kafka-topics.sh --create \
  --topic payment_requests \
  --partitions 48 \
  --replication-factor 3 \
  --config cleanup.policy=compact
The exactly‑once semantics of Kafka (enabled via idempotent producers and transactions) ensures that a payment is never double‑charged even when a consumer restarts.
Autoscaling with Predictive Models
Standard CPU‑based autoscaling can lag behind traffic spikes. By feeding historic traffic patterns into a time‑series forecasting model (e.g., Prophet or ARIMA), the system can pre‑scale pods 2‑5 minutes before a surge.
from prophet import Prophet
import pandas as pd

df = pd.read_csv("traffic_history.csv")  # columns: ds, y
model = Prophet()
model.fit(df)
future = model.make_future_dataframe(periods=10, freq='min')
forecast = model.predict(future)
The forecasted yhat values are exported to a Prometheus metric that the Horizontal Pod Autoscaler (HPA) consumes via the Custom Metrics API.
Security at Scale
PCI DSS Alignment
Payment Card Industry Data Security Standard (PCI DSS) is non‑negotiable for any system that stores, processes, or transmits cardholder data (CHD). Key technical controls include:
| PCI Requirement | Implementation Example |
|---|---|
| 3.1 – Keep cardholder data encrypted in transit | Enforce TLS 1.3 with mutual authentication between services. |
| 3.2 – Protect stored CHD | Use AWS KMS‑backed envelope encryption; raw PAN never resides in plaintext. |
| 4.1 – Use strong cryptography | RSA‑2048 for tokenization, SHA‑256 for integrity checks. |
| 7.1 – Restrict access by need‑to‑know | Leverage IAM roles and service mesh (e.g., Istio) for zero‑trust communication. |
| 10.2 – Log all access to cardholder data | Centralize logs in Splunk or Elastic Stack, enforce tamper‑evident storage. |
Compliance is verified continuously via automated SCAP scans and quarterly internal penetration tests.
Tokenization & Vaults
Never store a Primary Account Number (PAN) in a relational table. Instead, replace it with a token generated by a PCI‑validated vault (e.g., HashiCorp Vault with the card secrets engine).
# Request a token for a PAN using Vault CLI
vault write card/token \
  pan="4111111111111111" \
  expiration="12/27" \
  cvv="123"
The response contains a one‑time token that can be safely persisted. When settlement requires the original PAN, the vault returns it over a mutually authenticated TLS channel, and the plaintext exists only in memory for the duration of the call.
Zero Trust Network Segmentation
A service mesh enforces mutual TLS (mTLS) and fine‑grained authorization policies. For example, the risk engine should never be able to call the settlement service directly.
# Istio AuthorizationPolicy denying direct settlement access
apiVersion: security.istio.io/v1beta1
kind: AuthorizationPolicy
metadata:
  name: deny-risk-to-settlement
  namespace: payment
spec:
  selector:
    matchLabels:
      app: settlement-service
  rules:
  - from:
    - source:
        principals: ["cluster.local/ns/payment/sa/risk-engine"]
    when:
    - key: request.auth.claims[role]
      values: ["risk"]
  action: DENY
All traffic is logged to Envoy access logs, enabling forensic analysis of any lateral movement attempts.
Observability & Incident Response
Distributed Tracing
End‑to‑end latency visibility is essential. Instruments each service with OpenTelemetry and exports traces to a backend like Jaeger or Grafana Tempo.
// Go example using OpenTelemetry SDK
import (
    "go.opentelemetry.io/otel"
    "go.opentelemetry.io/otel/trace"
)

var tracer = otel.Tracer("payment-service")

func ProcessPayment(ctx context.Context, req PaymentRequest) error {
    ctx, span := tracer.Start(ctx, "ProcessPayment")
    defer span.End()
    // ... business logic ...
    return nil
}
Trace spans include attributes such as merchant.id, transaction.id, and risk.score, enabling engineers to pinpoint bottlenecks in real time.
Alerting & SLOs
Define Service Level Objectives (SLOs) for critical metrics:
- Availability – 99.999% of payment requests complete within 200 ms.
- Error Rate – < 0.01% of transactions result in a
5xxresponse. - Risk Latency – Risk engine returns a decision within 50 ms for 99% of events.
Prometheus alerts trigger on burn rate thresholds, automatically opening a ticket in PagerDuty.
# Prometheus rule for payment latency SLO breach
- alert: PaymentLatencySLOViolation
  expr: |
    (sum(rate(http_request_duration_seconds_bucket{le="0.2",handler="payment"}[5m]))
     / sum(rate(http_requests_total{handler="payment"}[5m]))) < 0.99999
  for: 2m
  labels:
    severity: critical
  annotations:
    summary: "Payment latency SLO breached"
    description: "Less than 99.999% of payments responded within 200 ms."
Post‑Mortem Process
When incidents occur, follow a blameless post‑mortem workflow:
- Timeline reconstruction using logs, traces, and metrics.
- Root cause analysis (5 Whys).
- Action items: code fix, runbook update, or architectural change.
- Share the post‑mortem across the org to spread learning.
Automation can generate the initial timeline via a Kibana Saved Search that pulls all relevant events for the incident window.
Key Takeaways
- Active‑active replication with quorum‑based databases eliminates regional outages and keeps latency low for global merchants.
- Event‑driven pipelines built on Kafka give you durable logs, exactly‑once processing, and natural back‑pressure handling.
- Sharding by merchant ID + time balances read/write locality and enables seamless horizontal scaling.
- PCI‑DSS compliance is achieved through tokenization, envelope encryption, zero‑trust networking, and continuous audit automation.
- Circuit breakers, bulkheads, and DNS failover protect the system from third‑party instability and prevent cascading failures.
- Observability stack (tracing, metrics, logs) coupled with well‑defined SLOs turns latency spikes into actionable alerts before customers notice.
Further Reading
- Stripe’s Architecture Overview – A public deep dive into a high‑throughput payment platform.
- PCI Security Standards Council – PCI DSS Documentation – Official requirements and validation procedures.
- Apache Kafka Documentation – Comprehensive guide to topics, partitions, and exactly‑once semantics.
- Google Cloud Payment Processing Solutions – Cloud‑native patterns for scaling payment workloads.