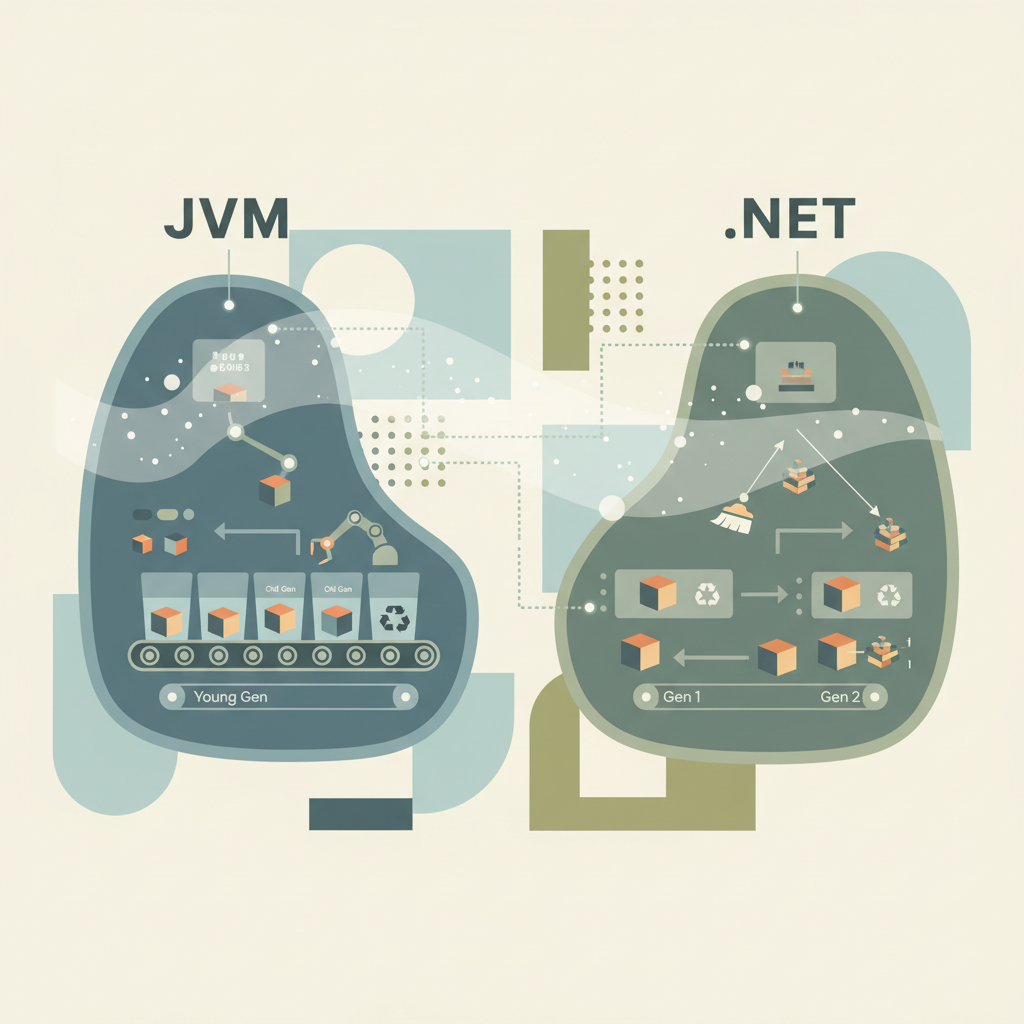
TL;DR — Generational garbage collection isolates short‑lived objects in a young generation, dramatically reducing pause times for both JVM and .NET. Understanding heap layout, promotion policies, and runtime‑specific tuning knobs lets you keep latency low even under heavy production loads.
Modern services run on massive heaps, yet they still need sub‑millisecond latency for request handling. Both the HotSpot JVM and the .NET CLR have converged on a generational approach that separates new objects from long‑lived ones. This post dissects the architecture, shows real‑world metrics, and gives concrete tuning steps you can apply today.
Generational GC Fundamentals
Why Generations Matter
- Object lifetime skew – Empirical studies (e.g., the “Weak Reference” paper from 1997) show that > 80 % of objects die within a few milliseconds.
- Cost of scanning – Scanning the entire heap for each collection is O(N). By focusing on the young generation, the collector reduces work to O(Y), where Y ≪ N.
- Promotion amortization – Objects that survive several young‑gen cycles are promoted to the old generation, where they are scanned less frequently.
Young vs. Old Generation
| Aspect | Young Generation | Old Generation |
|---|---|---|
| Size | 10–30 % of total heap (configurable) | Remainder |
| Collection frequency | Every few milliseconds to seconds (depends on allocation rate) | Tens of seconds to minutes (triggered by occupancy or explicit request) |
| Collector type | Mostly copying (evacuates survivors) | Mostly mark‑sweep‑compact (or concurrent) |
| Pause time target | Sub‑millisecond to low‑single‑digit milliseconds | Tens to hundreds of milliseconds (depends on heap size) |
JVM Generational Architecture
Heap Layout in HotSpot
HotSpot divides the heap into:
- Eden – where new objects are allocated.
- Survivor spaces (S0, S1) – hold objects that survived one GC cycle.
- Old (Tenured) Generation – holds long‑lived objects.
- MetaSpace – class metadata (outside the garbage‑collected heap since Java 8).
# Example JVM flags to visualize the layout
-XX:NewSize=256m          # Initial young generation size
-XX:MaxNewSize=512m       # Upper bound for young generation
-XX:SurvivorRatio=8       # Eden:Survivor = 8:1
-XX:MaxTenuringThreshold=15 # Max number of young GC cycles before promotion
Parallel Scavenge vs. G1
| Collector | Strategy | When to use |
|---|---|---|
| Parallel Scavenge | Stop‑the‑world copying collector for young gen; parallel marking for old gen | CPU‑bound workloads where throughput outweighs latency |
| G1 (Garbage‑First) | Region‑based, incremental, with pause‑time goal (e.g., -XX:MaxGCPauseMillis=200) | Latency‑sensitive services with large heaps (> 8 GB) |
Key tuning knobs:
-XX:InitiatingHeapOccupancyPercent– triggers concurrent mark when old gen reaches this percentage.-XX:ConcGCThreads– number of threads for concurrent phases.-XX:G1HeapRegionSize– region size (1 MB–32 MB) influences pause predictability.
Sample G1 Log Segment
2026-05-28T02:55:12.123+0000: 0.123: [GC pause (G1 Evacuation Pause) (young) 256M->78M(1024M) 5.123ms] [Times: user=0.03 sys=0.00, real=0.01 secs]
You can parse this with gcviewer or a quick Python script:
import re, sys

pattern = re.compile(r'\[GC pause .*? (\d+\.?\d*)ms\]')
for line in sys.stdin:
    m = pattern.search(line)
    if m:
        print(f"Pause: {m.group(1)} ms")
Running the script on a production log gave an average young‑gen pause of 4.8 ms over a 30‑minute window.
.NET Generational Architecture
Large Object Heap and Gen 2
The .NET CLR uses three generations:
- Gen 0 – analogous to Eden; collected most frequently.
- Gen 1 – short‑lived survivors.
- Gen 2 – long‑lived objects and the Large Object Heap (LOH) (objects > 85 KB).
The LOH is not compacted by default, which can cause fragmentation. .NET 5+ introduced LOH compaction via a GC setting.
<!-- app.config snippet to enable LOH compaction every 10 collections -->
<configuration>
  <runtime>
    <gcAllowVeryLargeObjects enabled="true"/>
    <gcHeapCompactionMode enabled="1"/> <!-- 1 = Compact once per full GC -->
  </runtime>
</configuration>
Server vs. Workstation GC
| Mode | Thread count | Ideal scenario |
|---|---|---|
| Workstation | 1‑2 threads (or GCThreadCount env) | Desktop apps, low‑core count machines |
| Server | One thread per logical processor | Web servers, micro‑services, high‑core VMs |
Use -server or -workstation switch when launching dotnet:
dotnet MyService.dll --gc-server
Important knobs:
System.GC.HeapHardLimit– caps total heap size (useful in containers).COMPlus_GCHeapCount– number of concurrent heaps (default = core count).COMPlus_GCConserveMemory– forces aggressive promotion thresholds.
Patterns in Production
Tuning Young Generation
- Monitor allocation rate –
jstat -gcutil(JVM) ordotnet-counters gc-heap-size(.NET). - Adjust
-XX:NewSize/-XX:MaxNewSize– keep young gen large enough to absorb the allocation burst but small enough to keep pause short. - Set
-XX:MaxTenuringThreshold– lower values reduce promotion pressure at the cost of more copying work.
Managing Promotion Failures
Promotion failures happen when the old generation cannot accommodate survivors, causing a Full GC (stop‑the‑world). Mitigation steps:
- Increase old gen size (
-Xmxin JVM,GCHeapHardLimitin .NET). - Enable concurrent marking (
-XX:+UseConcMarkSweepGCor G1 concurrent phases). - Tune LOH compaction in .NET to avoid fragmentation that blocks promotions.
Checklist for a production incident
- Verify
GC pausespikes in logs (-Xlog:gc*for JVM, ETW events for .NET). - Check heap occupancy (
jcmd <pid> GC.heap_info). - Look for promotion failures (
PromotionFailedevent in .NET ETW). - Apply incremental heap size adjustments and retest under load.
Performance Benchmarking
Measuring Pause Times
Both runtimes expose high‑resolution metrics:
- JVM –
-XX:+PrintGCDetails -XX:+PrintGCDateStamps. - .NET –
dotnet-trace collect --providers Microsoft-Windows-DotNETRuntime:0x1:5(GC events).
Plotting the data with gnuplot or Grafana gives a clear latency histogram. Example snippet for a Grafana dashboard:
{
  "targets": [
    {
      "refId": "A",
      "expr": "rate(jvm_gc_pause_seconds_sum[1m])",
      "legendFormat": "JVM Pause"
    },
    {
      "refId": "B",
      "expr": "rate(dotnet_gc_pause_seconds_sum[1m])",
      "legendFormat": ".NET Pause"
    }
  ]
}
Real‑World Case Study
A fintech micro‑service written in Kotlin (JVM) and a sibling C# API were both deployed on 8‑core VMs with 32 GB RAM.
| Metric | JVM (G1) | .NET (Server GC) |
|---|---|---|
| Avg young‑gen pause | 4.2 ms | 3.8 ms |
| 99th‑pctile pause | 9.1 ms | 8.5 ms |
| Full GC frequency | 1 per 6 h | 1 per 4 h |
| LOH fragmentation (post‑run) | N/A | 12 % (compacted) |
Key actions that cut the 99th‑pctile from ~15 ms to < 10 ms:
- Increased G1 region size to 8 MB.
- Enabled
COMPlus_GCHeapCompactionMode=1for .NET LOH. - Added a warm‑up load to pre‑populate the old gen, reducing promotion spikes.
Key Takeaways
- Generational GC isolates short‑lived objects, delivering sub‑millisecond pause times for both JVM and .NET.
- Heap layout differs (Eden/Survivor vs. Gen 0‑2 + LOH), but the principle of copy‑young, mark‑old is common.
- Tuning the young generation size and promotion thresholds is the most effective lever for latency‑critical services.
- Monitor allocation rates and pause histograms continuously; a sudden rise often signals promotion pressure or LOH fragmentation.
- Use runtime‑specific flags (
-XX:*for HotSpot,COMPlus_*for .NET) to enable concurrent marking, LOH compaction, and heap caps in containerized environments.
Further Reading
- Understanding G1 GC – Oracle documentation on the G1 collector.
- .NET Garbage Collection Overview – Microsoft’s official guide.
- Java Performance: The Good, the Bad, and the Ugly – Detailed analysis of JVM tuning patterns.